dicator created by J. Welles Wilder and is used to evaluate the strength of an upward or downward trend.
The ADX is an oscillator that ranges from 0 to 100, but the trend can be described as strong only above 30 points. The readings above 50 points are very rare and in this case they testify an excessive sentiment to be used in a contrary view. Conversely, all the readings below 20 points indicate a weak trend that could lead to a short-term burst of volatility.
Through the use of this indicator, we can understand at what stage of the market we are in at the moment: in trading range or in trend. This is quite an useful element for those who operate on Forex trading.
The Adx has to be used together with other indicators, in order to avoid false signals and prevent significant loss of money to Forex trading operators after opening a Forex account.
A commonly used technique that exploits the Adx is the “Holy Grail” due to its inventors, traders Connors and Raschke. If the Adx is over 30 points, then we get a directional phase in which the trend is gaining strength and the trader must search for a good entry point, obviously in the same direction of the trend itself. This result can be obtained by using the 20 days exponential moving average. But let’s see specifically how this happens.
An example of the power of these two techniques combined together can be displayed on the graph of EurPln. At the end of 2011, this cross achieved a top at 4.60, very easy to identify thanks to the so-called Wolfe Waves. Also in this case, a Pin Bar can reinforce the just formalized price pattern, proving to be incredibly powerful by determining the primary top of the period for EurPln.
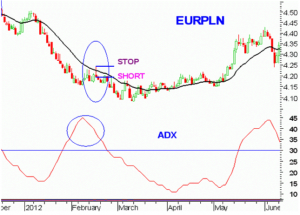
However, we are interested in combining the technique based on the Adx with Pin Bars and on February 2012, EurPln provided to Forex trading operators a great opportunity.
The strength of the trend was gradually growing over the months and the Adx exceeded 30 towards the end of January. At this point, we just had to wait for the first retracement of EurPln towards the 20 days exponential average. The correction began on February 8th and on February 16th EurPln touched the moving average providing a clearly bearish Pin Bar. Placing a long below the bottom of that figure (4.202) with a stop on the top (4.241) would have allowed the trader to increase the short positions on EurPln with a low risk. These indications are easily replicable by opening a Forex account through one of the many online brokers on the market.

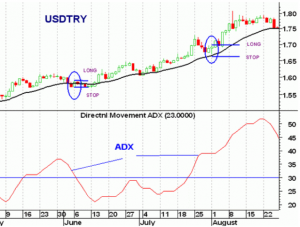
Here is another graphic example of how to combine the Adx to Pin Bars. The UsdTry trend was clearly bullish in 2011 with occasional corrections that offered some very attractive long investment opportunities for Forex trading operators. The Adx (thus the strength of the uptrend) overcame 30 points in the month of May, and, at that point, all the trader had to do was to wait for a correction on the 20 days moving average and build a long entry with a favorable risk-return relationship. The first opportunity came on June 6th. UsdTry fell (and the Adx too) and reached the 20 days average. So, the signal that the trader was waiting for finally happened: the formation of a bullish Engulfing Bar. The technique of the Adx (but also the Pin Bar one) planned to enter long above the top (in this case 1.5860) with stop a few pips below the bottom of the candle itself (1.5543). The result in that case was exciting, with UsdTry starting its rise again.
In late July, a new opportunity. The Adx rose again above 30. We were all waiting for the correction to arrive, and this happened on July 25th. On August 1st, UsdTry touched the exponential moving average at 20 days and realized a Pin Bar Even in this case, placing a long above the top of that day (1.6985) proved to be extremely profitable for those who opened a Forex account that allowed them to faithfully replicate the above mentioned Forex trading strategy.


Comments are closed